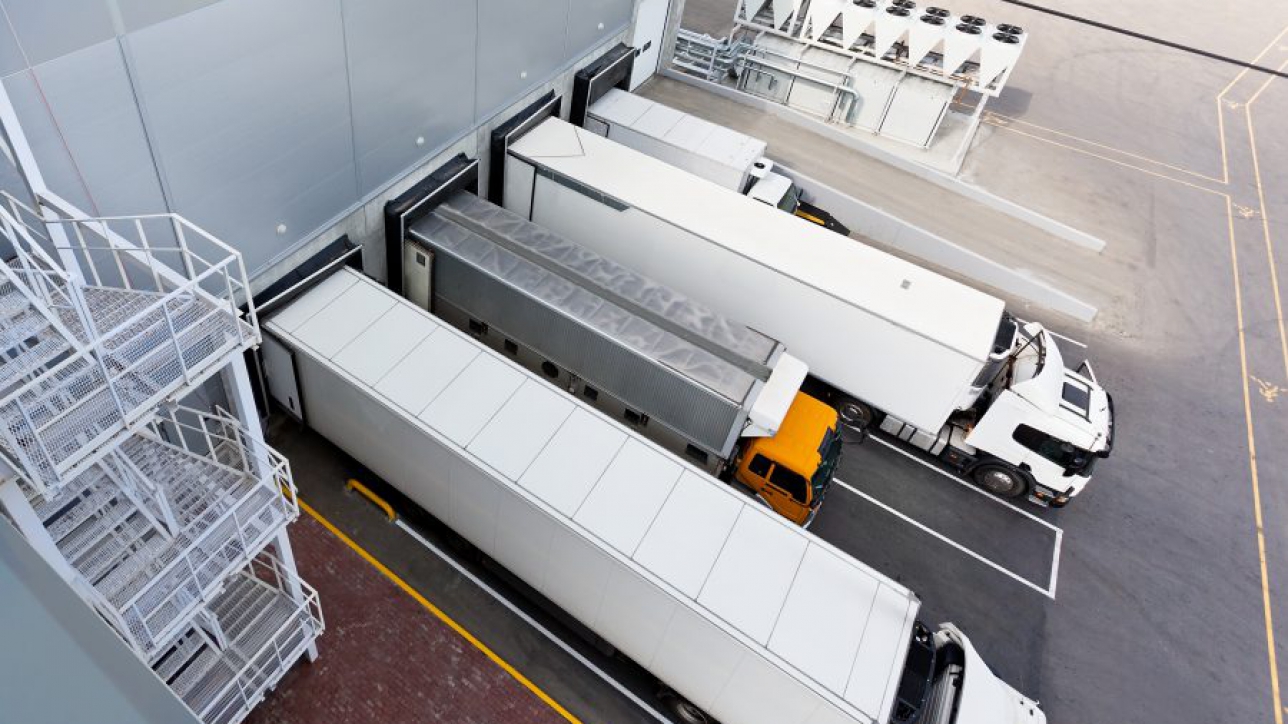
Southern California’s industrial sector remains strong. That is the good news, according to Xceligent’s Q1 2017 metrics. Though vacancies ticked up slightly quarter over quarter as absorption figures dropped, the statistics continue to show an active market highlighted by continued demand. Let’s take a look.
The Job Creation Juggernaut
During the current economic cycle, the state has gone from double-digit unemployment to the 5.1% unemployment reported in January 2017. Drilling down to the SoCal metros, the Inland Empire had the highest unemployment rate of 5.6%. Even so, the metro generated more than 38,000 jobs over a one-year period.
Meanwhile, in Orange County, the 3.9% unemployment rate suggests that there could be more demand (i.e., jobs available) than workers (supply) available to fill them. Though this is a good situation to have from an employee point of view, it will mean that employers will need to invest in ways to make their workplaces and jobs more attractive to the workforce.
Job Numbers for Southern California Markets
January 2016-January 2017
| Market Metro |
Jobs Created |
Industrial Jobs Created* |
Unemployment Rate |
| Inland Empire Riverside-San Bernardino-Ontario MSA |
38,600 |
13,500 |
5.6% |
| Los Angeles Los Angeles-Long Beach-Glendale MD |
68,500 |
2,100 |
5.1% |
| Orange County Anaheim-Santa Ana-Irvine MD |
17,000 |
2,400 |
3.9% |
| Ventura Oxnard-Thousand Oaks-Ventura MSA |
8,000 |
-500 |
5.1% |
*Manufacturing and Trade, Transportation & Utility Industries
Source: Xceligent, Bureau of Labor Statistics
Absorption Falls, Due to Lack of Available Space
Demand, once again, is calling the shots when it comes to industrial properties. Basically, there are plenty of companies wanting space, but not enough quality space, at this point, to meet what’s wanted. This is impacting absorption levels, especially in Los Angeles and Orange County, which dipped into negative absorption territory for the first time in years.
|
Metro |
Total Inventory |
Absorption (SF) |
Deliveries (SF) |
Construction |
|
Inland Empire |
505.7 M |
2,400,000 | 4,500,000 |
23,500,000 |
|
Los Angeles |
760.5 M |
-477,413 | 93,453 |
7,400,000 |
|
Orange County |
249.7 M |
-451,454 | 41,668 |
231,069 |
|
Ventura |
65.4 M |
674,208 | 0 |
844,435 |
Source: Xceligent
The Orange County absorption rate was especially impacted by move-outs from Money Mailer, Super D and Staton Corporate & Casual. Los Angeles, in the meantime, has companies with few expansion options, though the metro is on tap to deliver 7.4 million square feet. Xceligent analysts tell us that the lack of quality industrial space mean potential tenants will keep an eye out on the Inland Empire, which is expected to deliver plenty of new, state-of-the-art distribution facilities.Demand, once again, is calling the shots when it comes to industrial properties. Basically, there are plenty of companies wanting space, but not enough quality space, at this point, to meet what’s wanted. This is impacting absorption levels, especially in Los Angeles and Orange County, which dipped into negative absorption territory for the first time in years.
Additionally, Xceligent believes that the negative absorption is a blip on an otherwise positive outlook. Several large tenants are anticipated to sign and occupy space during the next two quarters, in Orange County. And there is plenty going on in the pipeline. Construction is expected to launch within the next several months on the 500,000-square-foot Conejo Spectrum Business Park (Ventura) and the 976,000-square-foot Beckman Business Parks (Orange County).
In fact, Conejo Spectrum is Ventura’s first major development in more than 10 years. Xceligent analysts tell us that project could catch tenant overflow from the San Fernando Valley, because of few expansion options throughout Greater Los Angeles.
Demand Leads to Low Vacancies
Total vacancies increased in the Inland Empire, Los Angeles and Orange County. Even with this, the vacancy rate remained well below 5% across all four metros. While such a metric is a positive sign for demand, it also signals a serious lack of available space. It’s likely that lack will be addressed as more square footage delivers, but the chances are good that low vacancies will be with the region for the next few quarters.
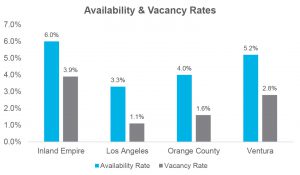
Source: Xceligent
An interesting exercise is to take a deeper look at what’s going on regionally. For example, out of the Inland Empire’s total inventory of more than 505 million square feet, approximately 30 million square feet is available, out of which 19 million is vacant. That might seem to be a lot of space, but according to the chart below, there seems to be a lack of flex space in both the east and west submarkets.
| Market Name | Use |
Inventory |
Available | Vacant |
Net Absorption |
| Inland Empire East | Flex |
9,049,322 |
211,827 | 198,618 |
15,784 |
| Whse/Dist |
211,551,729 |
17,135,423 | 12,420,697 |
1,834,120 |
|
| Inland Empire West | Flex |
7,747,759 |
227,386 | 99,825 |
-27,975 |
| Whse/Dist |
277,394,466 |
12,626,509 | 6,871,329 |
555,383 |
Source: Xceligent
What’s Next?
The Xceligent analysts believe that, as new space is delivered to the various metros, absorption should increase, along with vacancies. As Southern California continues to generate more jobs, look for continued single-digit vacancies – at least, until construction has a chance to catch up with demand.